Image Details
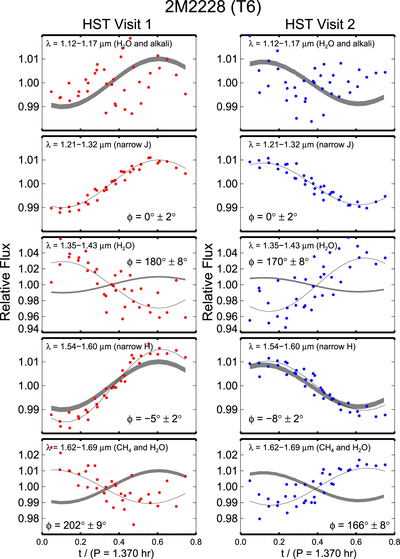
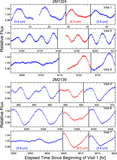
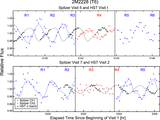
Caption: Figure 13.
Phase-folded HST narrowband light curves of 2M2228. The solid lines are the best-fit sine-wave models, and the dark gray bands are the best-fit models to the J-band light curves, with the widths of the bands representing the scatter in the data. We detected phase shifts between four narrow bands, and the results are consistent with that measured by Buenzli et al. (2012).
Other Images in This Article
Show More
Copyright and Terms & Conditions
© 2016. The American Astronomical Society. All rights reserved.
Copyright ©
2025 Astronomy Image Explorer. All Rights Reserved.