Image Details
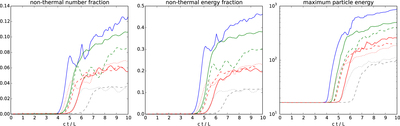
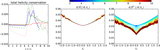
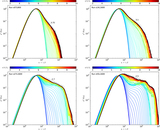
Caption: Figure 9.
Left panel: time evolution of the number fraction contained in the nonthermal high-energy tail of the electron distribution. Middle panel: time evolution of the energy fraction contained in the high-energy tail. Right panel: time evolution of the maximum particle Lorentz factor measured at the level of u2N(u) = 10−3 for normalized electron distributions. Line colors and types are the same as in Figure 2.
Other Images in This Article
Show More
Copyright and Terms & Conditions
© 2016. The American Astronomical Society. All rights reserved.
Copyright ©
2026 Astronomy Image Explorer. All Rights Reserved.