Image Details
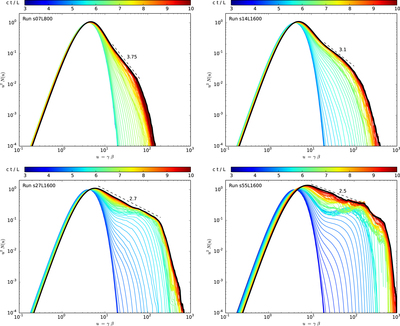
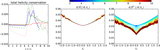
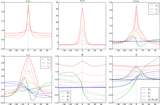
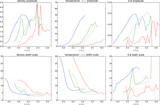
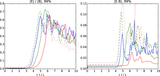
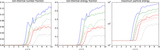
Caption: Figure 8.
Evolution of the momentum distributions u2N(u) of electrons and positrons for selected runs. The color scale indicates simulation time normalized to the light-crossing timescale L/c. The distributions are sampled at linearly uniform time intervals; however, the intervals are different for each simulation.
Other Images in This Article
Show More
Copyright and Terms & Conditions
© 2016. The American Astronomical Society. All rights reserved.
Copyright ©
2026 Astronomy Image Explorer. All Rights Reserved.