Image Details
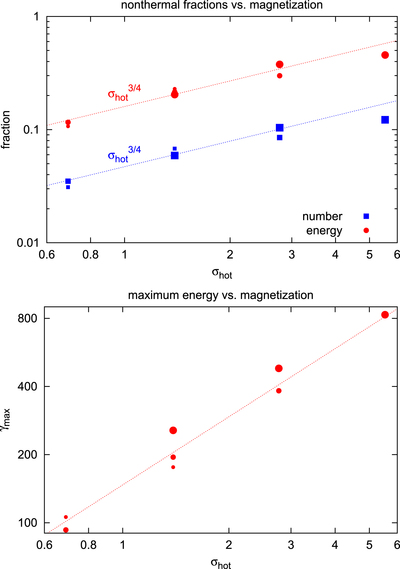
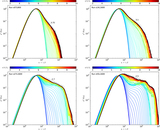
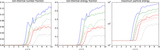
Caption: Figure 10.
Top panel: dependence of the number (blue squares) and energy (red circles) fractions contained in the high-energy tail of the electron distribution, averaged for ct/L ∈ [9:10], on the mean hot magnetization value. Bottom panel: dependence of the maximum Lorentz factor measured at the level of u2N(u) = 10−3 for normalized electron distributions, averaged for ct/L ∈ [9:10]. The point size indicates the simulation domain size L.
Other Images in This Article
Show More
Copyright and Terms & Conditions
© 2016. The American Astronomical Society. All rights reserved.
Copyright ©
2026 Astronomy Image Explorer. All Rights Reserved.