Image Details
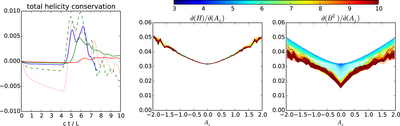
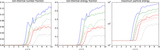
Caption: Figure 4.
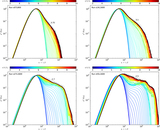
Left panel: accuracy of total helicity conservation ﹩{ \mathcal H }(t)/{ \mathcal H }(0)-1﹩ compared for several simulations. Line colors and types are the same as in Figure 2. Middle panel: time evolution of the helicity profile ﹩\partial { \mathcal H }/\partial {A}_{z}﹩ for Run s14L1600. Right panel: time evolution of the magnetic energy profile ﹩\partial ({B}^{2})/\partial {A}_{z}﹩ for Run s14L1600. For the middle and right panels, the color scale indicates simulation time normalized to the light-crossing timescale L/c.
Other Images in This Article
Show More
Copyright and Terms & Conditions
© 2016. The American Astronomical Society. All rights reserved.
Copyright ©
2026 Astronomy Image Explorer. All Rights Reserved.