Image Details
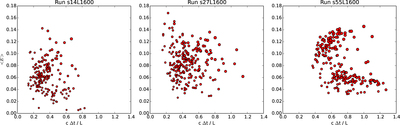
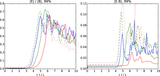
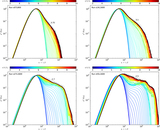
Caption: Figure 12.
Duration vs. mean electric field calculated for the main acceleration episodes for representative samples of energetic individually tracked particles. The area of the markers is proportional to the final particle energy γfin calculated for ct/L = 10. Each diagram shows roughly 200 most energetic particles.
Other Images in This Article
Show More
Copyright and Terms & Conditions
© 2016. The American Astronomical Society. All rights reserved.
Copyright ©
2026 Astronomy Image Explorer. All Rights Reserved.