Image Details
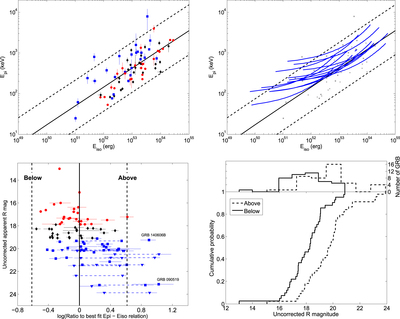
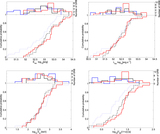
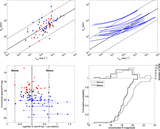
Caption: Figure 9.
Top left: distribution of the 76 GRBs with a redshift in the E﹩{}_{{\rm{pi}}}﹩–E﹩{}_{{\rm{iso}}}﹩ plane with its 2σ limit (dashed line). The red circles corresponds to the population of GRBs with bright afterglows, the black diamonds corresponds to the GRB afterglow with intermediate flux, and the blue squares corresponds to the faint GRB afterglows. Top right: distribution of the 14 GRBs without a redshift in the E﹩{}_{{\rm{pi}}}﹩–E﹩{}_{{\rm{iso}}}﹩ plane with its 2σ limit (dashed line). They all appear in the class of GRBs with faint afterglows (blue solid line). Bottom left: distribution of the uncorrected R magnitude as a function of the vertical distance to the best fit to the E﹩{}_{{\rm{pi}}}﹩–E﹩{}_{{\rm{iso}}}﹩ relation for our global sample of GRBs (90 GRBs). Bottom right: cumulative distribution function of the uncorrected R magnitude between GRBs located above the best-fit E﹩{}_{{\rm{pi}}}﹩–E﹩{}_{{\rm{iso}}}﹩ relation (dashed line) and those located below the best-fit E﹩{}_{{\rm{pi}}}﹩–E﹩{}_{{\rm{iso}}}﹩ relation (solid line). This analysis used a sample of 76 GRBs with a redshift and 8 GRBs without one.
Other Images in This Article

Copyright and Terms & Conditions
© 2016. The American Astronomical Society. All rights reserved.