Image Details
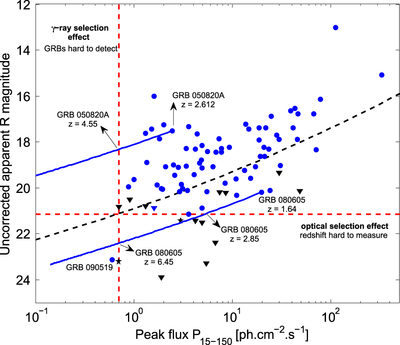
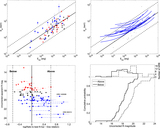
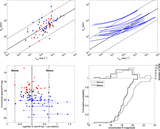
Caption: Figure 7.
Our GRB sample in the peak flux–R mag plane. GRBs with a redshift measurement are represented in blue (circles for GRB afterglows with a well-measured R magnitude, downward triangles for optical upper limits). GRBs without a redshift measurement are represented in black (stars for GRB afterglows with a well-measured R magnitude, downward triangle for optical upper limits). The red dashed lines represent the limiting peak flux and the limiting R magnitude for GRB detection and redshift measurement, respectively. The black dashed line divides the population of GRBs that would undergo the γ-ray selection effect before the optical one (above this line) from those that first suffer from the optical selection effect (below this line).
Other Images in This Article

Copyright and Terms & Conditions
© 2016. The American Astronomical Society. All rights reserved.