Image Details
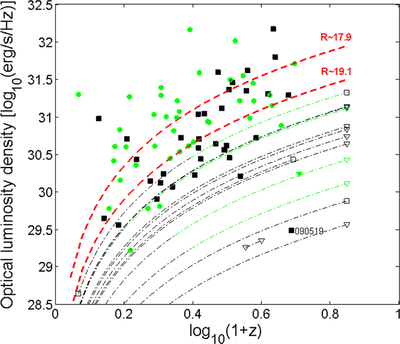
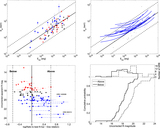
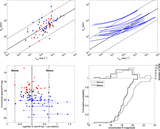
Caption: Figure 6.
Intrinsic optical luminosity density as a function of redshift for 76 GRBs with a redshift and 14 GRBs without a redshift (dashed–dotted lines). Upper limits are plotted as downward triangles. The red dashed lines indicates the iso-magnitude of the optical afterglow as a function of the redshift (up to z = 6.0). They define our three classes of optical afterglow flux (bright are GRBs with ﹩R\,\leqslant ﹩ 17.9, intermediate are GRBs with ﹩17.9\lt R\leqslant 19.1﹩, and faint are GRBs with ﹩R\gt 19.1﹩). As discussed in Section 6, the green circles represent GRBs below the best-fit E﹩{}_{{\rm{pi}}}﹩–E﹩{}_{{\rm{iso}}}﹩ relation while black squares represent GRBs located above the best-fit E﹩{}_{{\rm{pi}}}﹩–E﹩{}_{{\rm{iso}}}﹩ relation. For GRBs without a redshift, the color of the dashed–dotted line indicates whether the GRB is located below the best-fit E﹩{}_{{\rm{pi}}}﹩–E﹩{}_{{\rm{iso}}}﹩ relation (green) or above it (black).
Other Images in This Article

Copyright and Terms & Conditions
© 2016. The American Astronomical Society. All rights reserved.