Image Details
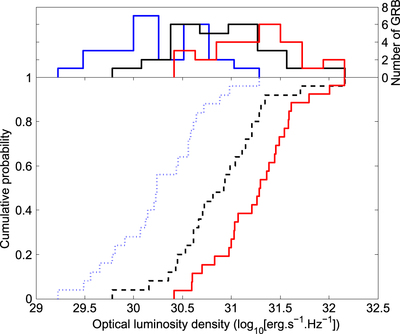
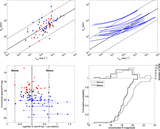
Caption: Figure 5.
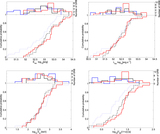
Cumulative distribution function (bottom) and histogram (top) of the optical luminosity density (taken 2 hr after the burst in the rest frame) for the three classes of GRBs. The bright, intermediate, and faint GRB afterglows are indicated by solid red, dashed black, and dotted blue lines, respectively.
Other Images in This Article

Copyright and Terms & Conditions
© 2016. The American Astronomical Society. All rights reserved.
Copyright ©
2025 Astronomy Image Explorer. All Rights Reserved.