Image Details
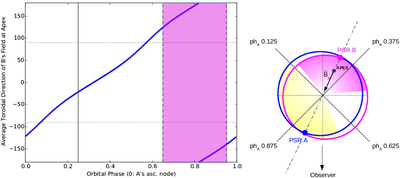
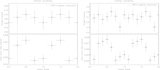
Caption: Figure 6.
Left panel: component of the PSR B’s magnetic field in the orbital plane averaged over one spin period. The pink shaded region indicates where the PSR B’s flux reaches its maximum values, while the vertical black line marks the eclipse of PSR A. Right panel: scheme of the emission direction of PSR B. The black arrow at the top indicates the orientation of the average toroidal direction of the PSR B’s magnetic field, ﹩{\bar{B}}_{\parallel }﹩, when PSR B is located at the center of its brightest orbital phase interval, indicated by the pink shaded region. While the shaded yellow region represents the range of orbital phases in which the total flux reaches its maximum values.
Other Images in This Article

Copyright and Terms & Conditions
© 2016. The American Astronomical Society. All rights reserved.