Image Details
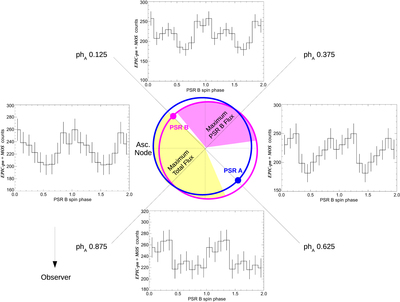
Caption: Figure 4.
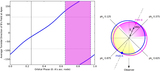
Central panel: scheme of the orbital configuration of PSR J0737−3039 in 2011 subdivided into four orbital phase intervals containing conjunctions ([0.125, 0.375]–[0.625, 0.875]) and quadratures ([0.875, 0.125]–[0.375, 0.625]). The yellow shaded region corresponds to the maximum of the total X-ray flux from the system (see Section 5 and Figure 5), while the pink area indicates the maximum of the PSR B pulsed flux (both shaded regions highlight the orbital phase intervals where PSR B is passing). The phA label in the figure highlights that phase 0 refers to the PSR A ascending node. The four plots displayed around the scheme show the PSR B (background-subtracted) pulse profile obtained by folding the 2011 EPIC-MOS and EPIC-pn counts belonging to the above mentioned orbital phases for the 0.15–3.0 keV energy band (the pulsed profiles are referred to as the orbital phase intervals where PSR B is passing).
Other Images in This Article

Copyright and Terms & Conditions
© 2016. The American Astronomical Society. All rights reserved.