Image Details
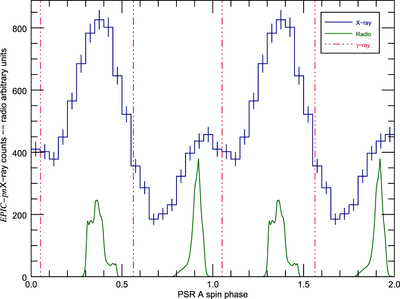
Caption: Figure 2.
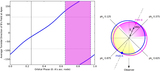
Result of phasing of the PSR A’s pulsed profile. The X-ray profile obtained for 0.15–3.0 keV is represented by the solid blue line. The green line shows the radio profile at 820 MHz in arbitrary units. While the dotted–dashed red vertical lines indicate the phase value of the maximum of the γ-ray pulses. Two rotational phases are displayed for clarity.
Other Images in This Article

Copyright and Terms & Conditions
© 2016. The American Astronomical Society. All rights reserved.
Copyright ©
2025 Astronomy Image Explorer. All Rights Reserved.