Image Details
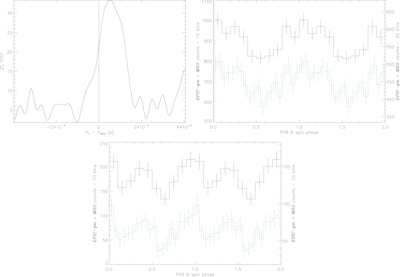
Caption: Figure 3.
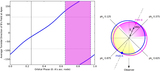
X-ray detection of PSR B. Top left: result of the ﹩{Z}_{4}^{2}﹩ test distribution for 100 period search trials around PSR B’s radio ephemeris. Top right: background-subtracted PSR B profile for the 0.15–3.0 keV energy band obtained by folding the 2011 combined EPIC-MOS and EPIC-pn data (both light curves with 10 bins—in black—and 20 bins—in green—are displayed). Bottom: same as top right, but selecting the orbital phase interval ﹩{\rm{\Delta }}{\phi }_{\mathrm{orb}}﹩ = 0.58–0.78.
Other Images in This Article

Copyright and Terms & Conditions
© 2016. The American Astronomical Society. All rights reserved.
Copyright ©
2025 Astronomy Image Explorer. All Rights Reserved.