

Image Details
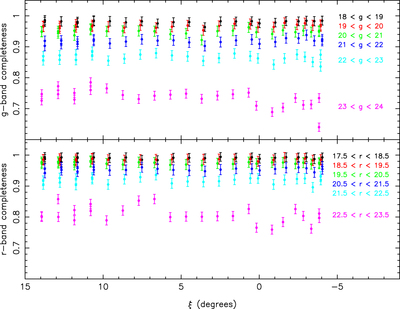
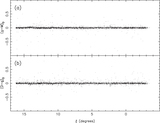
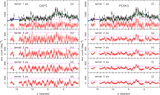
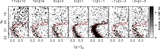
Caption: Figure 13.
Completeness fraction for the g-band data (upper panel) and r-band data (lower panel). The magnitude intervals are shown in the same color as the corresponding measurements. For clarity, we have applied small offsets to the ξ values in different magnitude intervals.
Other Images in This Article
Show More
Copyright and Terms & Conditions
© 2016. The American Astronomical Society. All rights reserved.

Copyright ©
2026 Astronomy Image Explorer. All Rights Reserved.
