

Image Details
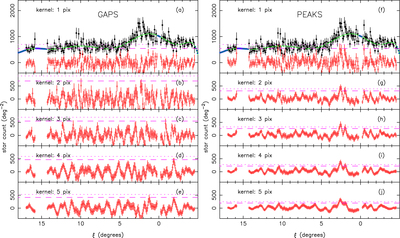
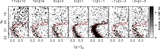
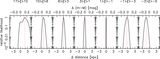
Caption: Figure 8.
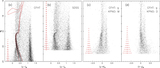
Gap (left panels) and peak (right panels) analysis of the CFHT star-counts. The black dots in the upper panels reproduce the stream star-counts from Figure 7(b), but with the counts in the central ﹩0\buildrel{\circ}\over{.} 5﹩ around the cluster removed. The green line shows a ninth-order polynomial fit through the black dots. Where data are missing, we fill in the profile with the value from the fitted polynomial (blue dots). Red dots show the result of applying the gap filter of Carlberg et al. (2012); from panel (a) to (e) the width of this filter kernel is increased from 1 to 5 pixels. Positive spikes in the red distribution correspond to possible gaps in the stream. The pink dashed and dotted lines show, respectively, the level of the highest 10% and 1% spikes in Monte Carlo simulations, drawing samples consistent with the polynomial fit. The observed gaps are therefore not highly significant. The right-hand panels show the same analysis, but for overdensities in the stream (using a peak-finding filter).
Other Images in This Article
Show More
Copyright and Terms & Conditions
© 2016. The American Astronomical Society. All rights reserved.

