

Image Details
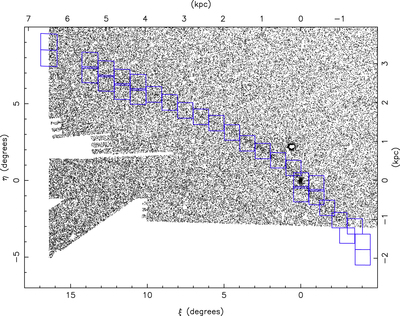
Caption: Figure 1.
Main photometric survey fields used in this study. In all the maps presented in this study, ﹩\xi ,\eta ﹩ are standard coordinates with respect to the center of Palomar 5 (i.e., ﹩\xi ,\eta ﹩ are locally parallel to celestial coordinates at the position of Palomar 5, taken as the tangent point). The background black dots show the point sources in the SDSS in the vicinity of Palomar 5, selected from the de-reddened ﹩{(g-r)}_{0},{g}_{0}﹩ color–magnitude diagram (CMD). These stars have magnitudes ﹩20\lt {g}_{0}\lt 21.5﹩, and were selected in a narrow CMD region around the observed turnoff of Palomar 5. This is close to the best map that can be obtained from the SDSS without resorting to statistical methods (which generally replace stars by weights). The Palomar 5 stream lies toward the edge of the SDSS footprint, which explains the irregular coverage toward the south and east in this diagram. The 30 blue squares show the longer-exposure CFHT MegaCam field pointings used in this study. For clarity we have not shown the positions of the shorter-exposure fields, but these form an interlocking pattern with the longer-exposure fields. The physical scale of the stream can be appreciated from the top and right-hand axes (where we have assumed a distance of ﹩23.5\;\mathrm{kpc}﹩, Dotter et al. 2011). The cluster remnant is clearly visible at ﹩(\xi ,\eta )=(0,0)﹩, while the overdensity of stars at ﹩(\xi ,\eta )\approx (+0.5,2)﹩ is due to the (unrelated) globular cluster M5.
Other Images in This Article
Show More
Copyright and Terms & Conditions
© 2016. The American Astronomical Society. All rights reserved.

