

Image Details
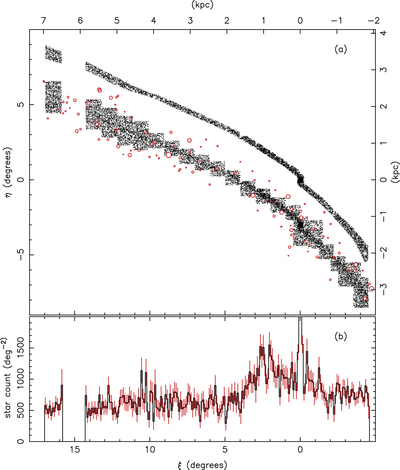
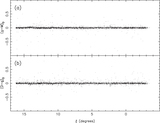
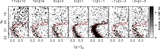
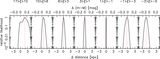
Caption: Figure 7.
The Palomar 5 stellar stream derived from CFHT data. Panel (a) displays the CFHT stars, selected from the color–magnitude box surrounding the main sequence for the range ﹩20\lt {g}_{0}\lt 23﹩ shown in Figure 5(a). This sub-sample is shown shifted south by ﹩3^\circ ﹩. A further sub-sample, spatially selected to follow the stream-like structure, is shown at the actual (﹩\xi ,\eta ﹩) position. The red circles show the (﹩\xi ,\eta ﹩) positions of bright stars (also shifted south by ﹩3^\circ ﹩); all survey stars within these circular regions are removed from the sample. The histogram in panel (b) displays the distribution of stellar density along the stream, properly flat-fielded, and limited to ﹩20\ \leqslant \ {g}_{0}\ \leqslant \ 23﹩, to which magnitude the survey is homogenous.
Other Images in This Article
Show More
Copyright and Terms & Conditions
© 2016. The American Astronomical Society. All rights reserved.

