

Image Details
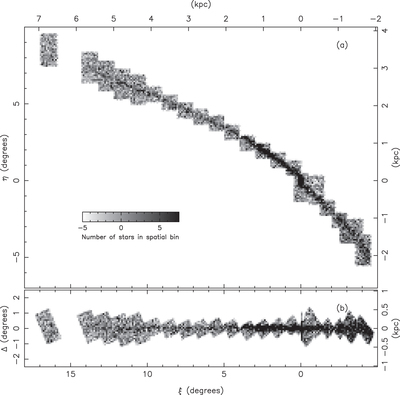
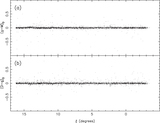
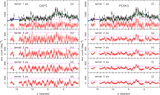
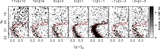
Caption: Figure 11.
(a) Matched-filter map of the Palomar 5 stream, using the CFHT data down to ﹩{g}_{0}=24﹩. The insert shows the density of stars per ﹩0\buildrel{\circ}\over{.} 1\times 0\buildrel{\circ}\over{.} 1﹩ spatial bin. The CMD filter has been shifted slightly in magnitude by ﹩0.009\left[\frac{\xi }{{\rm{1}}\;{\rm{deg}}}\right]﹩ to account for the distance gradient revealed in Figure 10. The scatter in the background off-stream regions in this map is approximately 2.4 counts. Panel (b) shows a re-projection of these data binned along the ξ coordinate axis, oriented so that Δ measures distance perpendicular to our stream fit.
Other Images in This Article
Show More
Copyright and Terms & Conditions
© 2016. The American Astronomical Society. All rights reserved.

