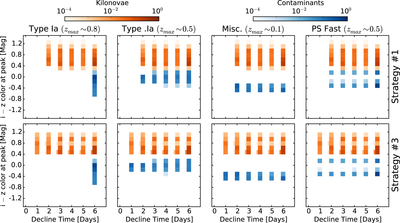
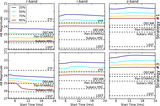
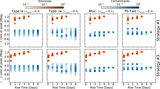
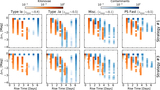
Decline time–color slice of the decline time–color–magnitude phase space. The plot is constructed using the same methodology as in Figures 8 and 9. We note that, as before, kilonovae show redder i − z colors than the contaminant population. However, there is no strong separation in decline time.