Image Details
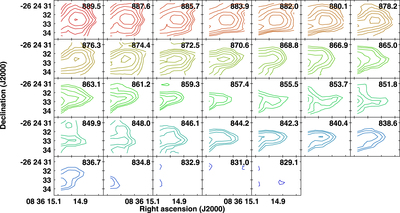
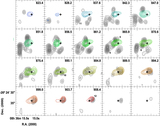
Caption: Figure 8.
Channel maps of the W emission region at velocities from the line peak through the “blue bump.” The panes are labeled by velocity and are spaced by 2 pixels, less than one resolution element. Contours are ﹩{2}^{n/2}\times 7\times {10}^{-3}\;\mathrm{erg}{({\rm{s}}\;{\mathrm{cm}}^{-1}{\mathrm{cm}}^{2}\;\mathrm{sr})}^{-1}.﹩
Other Images in This Article
Copyright and Terms & Conditions
© 2015. The American Astronomical Society. All rights reserved.
Copyright ©
2025 Astronomy Image Explorer. All Rights Reserved.