Image Details
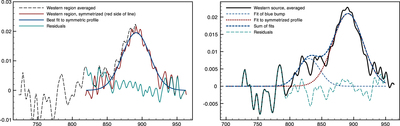
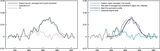
Caption: Figure 4.
Left: the [Ne II] line averaged over the W source, the symmetrized profile made by reflecting the red half of the line, the best single Gaussian fit to the symmetrized data, and the residuals of the original, non-symmetrized data. X-axis units are km s−1 and Y axis units are erg(s cm−1 cm2 sr)−1. Note that the original data and the symmetrized are very similar except in the high noise region around 830 km s−1. Right: the same as the left panel, with another Gaussian appropriate for the “blue bump” added. The formal significance of the second Gaussian is low because of the high noise.
Other Images in This Article
Copyright and Terms & Conditions
© 2015. The American Astronomical Society. All rights reserved.
Copyright ©
2025 Astronomy Image Explorer. All Rights Reserved.