Image Details
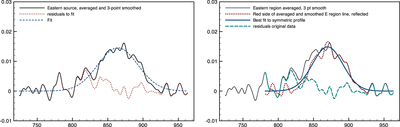
Caption: Figure 5.
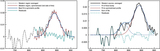
Left: the [Ne II] line averaged and three-point smoothed over the E source and the best single Gaussian fit. The fit is clearly better on the blue side of the line than on the left. Right: the original line profile, the symmetrized line profile produced by reflecting the red half, the best single Gaussian fit to the symmetrized data, and the residuals of the original data, for the E source. X-axis units are km s−1 and Y axis units are erg(s cm−1 cm2 sr)−1.
Other Images in This Article
Copyright and Terms & Conditions
© 2015. The American Astronomical Society. All rights reserved.
Copyright ©
2025 Astronomy Image Explorer. All Rights Reserved.