Image Details
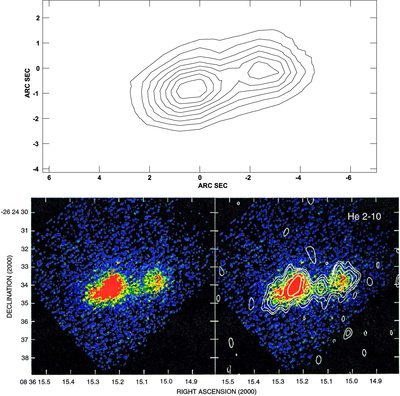
Caption: Figure 1.
Top: the spatial distribution of the [Ne II] emission, found by taking the zeroth moment of the data cube. The contours are integer multiples of ﹩10\%﹩ of the peak value of ﹩3.42\;\mathrm{erg}{({\rm{s}}\;{\mathrm{cm}}^{2}\;\mathrm{sr})}^{-1}.﹩ Bottom: the ﹩12\;\mu {\rm{m}}﹩ continuum emission (left) and the 2 cm radio contours (right) from Beck et al. (2001). The infrared spatial resolution was ﹩0\buildrel{\prime\prime}\over{.} 3\times 0\buildrel{\prime\prime}\over{.} 5.﹩ The radio contours are ﹩0.2\;\mathrm{mJy}\;{\mathrm{beam}}^{-1}﹩ times ﹩\pm {2}^{n/2}﹩ and the beam ﹩0\buildrel{\prime\prime}\over{.} 8\times 0\buildrel{\prime\prime}\over{.} 4.﹩
Other Images in This Article
Copyright and Terms & Conditions
© 2015. The American Astronomical Society. All rights reserved.