Image Details
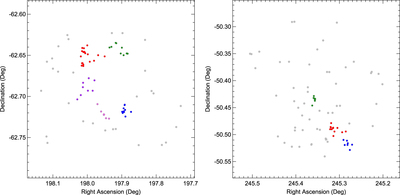
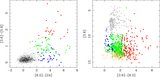
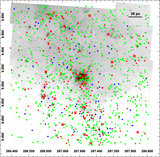
Caption: Figure 17.
Left: subclusters identified in the rescaled G305 star-forming region using the W49 cutoff distance dc = 40″. The YSOs are plotted in colors according to the clusters identified. The distributed YSO candidates not assigned to groups are plotted with gray points. Right: same as the left panel, but for G333.
Other Images in This Article
Show More
Copyright and Terms & Conditions
© 2015. The American Astronomical Society. All rights reserved.
Copyright ©
2026 Astronomy Image Explorer. All Rights Reserved.