Image Details
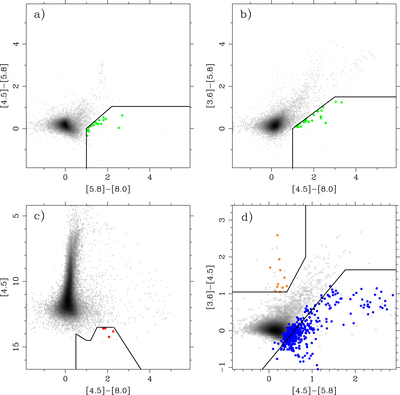
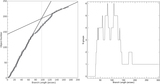
Caption: Figure 5.
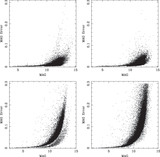
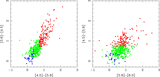
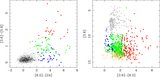
Color–color and color–magnitude diagrams used to identify contaminant objects among the sources with detection at all four IRAC bands following the criteria in Gutermuth et al. (2009). The background logarithmic gray scale indicates the overall source density in each color–color and color–magnitude space. In panels (a) and (b), PAH galaxies are marked with green circles. In panel (c), candidate AGNs are marked by red circles. Panel (d) shows knots of shocked emission (orange circles) and PAH-contaminated sources (blue circles).
Other Images in This Article
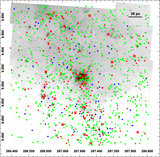
Show More
Copyright and Terms & Conditions
© 2015. The American Astronomical Society. All rights reserved.
Copyright ©
2026 Astronomy Image Explorer. All Rights Reserved.