Image Details
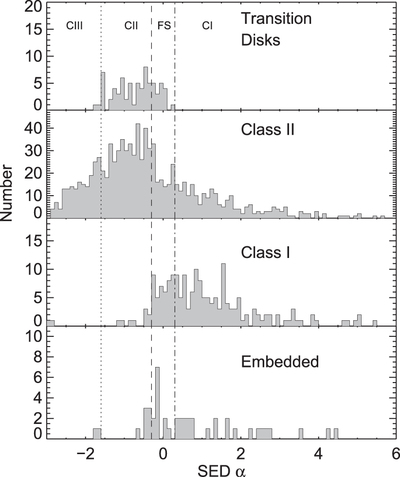
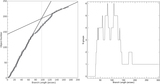
Caption: Figure 8.
Distribution of the SED spectral index α for sources identified as YSO candidates. The three vertical lines mark the division between the YSO regions based on their SED slopes. From left to right: Class II, flat spectrum, and Class I.
Other Images in This Article
Show More
Copyright and Terms & Conditions
© 2015. The American Astronomical Society. All rights reserved.
Copyright ©
2026 Astronomy Image Explorer. All Rights Reserved.