Image Details
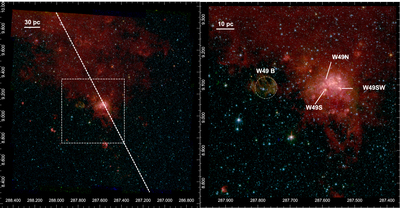
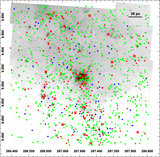
Caption: Figure 2.
Left panel shows a color image of the entire mosaic in the Spitzer IRAC bands (blue: 3.6 μm, green: 4.5 μm, red: 8.0 μm). The dashed line denotes the Galactic plane. The field shown by the dashed gray box is where we performed the clustering analysis, which is shown in detail in the right panel. The size scales in pc assume a distance to W49 of 11.1 kpc.
Other Images in This Article
Show More
Copyright and Terms & Conditions
© 2015. The American Astronomical Society. All rights reserved.
Copyright ©
2026 Astronomy Image Explorer. All Rights Reserved.