Image Details
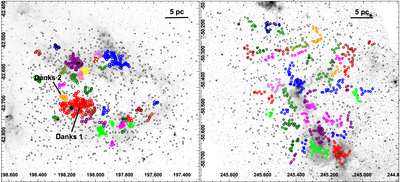
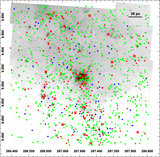
Caption: Figure 16.
Left: subclusters identified in the G305 star-forming region (using ﹩{d}_{c}=30^{\prime\prime} ﹩) are overlaid on the IRAC 5.8 μm image. Right: subclusters identified in the G333 star-forming region (using ﹩{d}_{c}﹩ = 52″) are overlaid on the IRAC 5.8 μm image. Distributed YSO candidates not assigned to groups are plotted with gray points.
Other Images in This Article
Show More
Copyright and Terms & Conditions
© 2015. The American Astronomical Society. All rights reserved.
Copyright ©
2026 Astronomy Image Explorer. All Rights Reserved.