Image Details
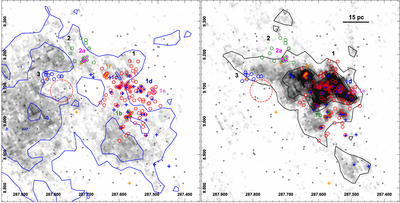
Caption: Figure 15.
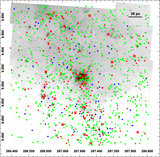
13CO(1–0) integrated intensity contours (Simon et al. 2001) and YSO clusters overlayed on CO maps in gray scale. Left: 13CO(1–0) intensity is integrated over the velocity range associated with GRSMC 43.30–0.33 (﹩{\nu }_{\mathrm{LSR}}=35-50\mathrm{km}\;{{\rm{s}}}^{-1}﹩), and contour levels are 2.5, 6.25, 10 K km s−1, shown in blue; right: 13CO(1–0) intensity is integrated over the velocity range associated with W49 GMC (﹩{\nu }_{\mathrm{LSR}}=-5-25\;\mathrm{km}\;{{\rm{s}}}^{-1}﹩), and contour levels are 2.5, 14, 25.5, 37, 48.5, and 60 K km s ﹩{}^{-1}﹩ for W49 GMC, shown in black. Blue crosses show the dust clumps determined at 11.1–11.4 kpc, and orange crosses show the dust clumps determined at 4.10–7.30 kpc by Matthews et al. (2009). The red circle indicates the position of the supernova remnant W49B.
Other Images in This Article
Show More
Copyright and Terms & Conditions
© 2015. The American Astronomical Society. All rights reserved.