Image Details
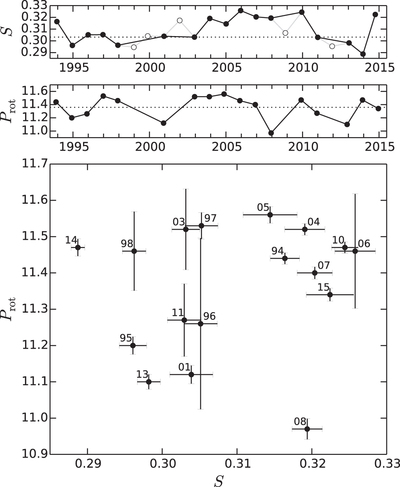
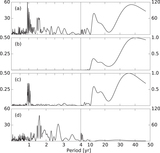
Caption: Figure 6.
Top two panels: time series of seasonal rotation period measurements beneath seasonal mean S-index time series, for comparison. Filled (open) circles are measurements for seasons in which a rotation period detection was successful (unsuccessful). A horizontal dotted line marks the grand mean for the whole time series. Bottom panel: seasonal activity-rotation correlation plot, with error bars representing 1σ uncertainty in the rotation period and seasonal mean S value. Data points are annotated with the two-digit year.
Other Images in This Article
Copyright and Terms & Conditions
© 2015. The American Astronomical Society. All rights reserved.
Copyright ©
2025 Astronomy Image Explorer. All Rights Reserved.