Image Details
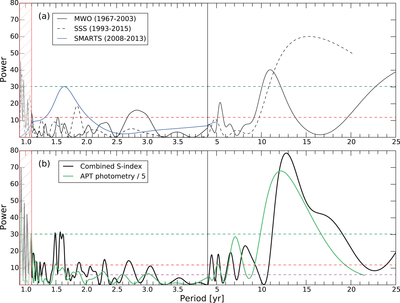
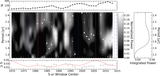
Caption: Figure 3.
Lomb–Scargle periodograms from the time series of Figure 1. Panel (a) contains the result from single-instrument S-index surveys and panel (b) the combined S-index time series, as well as the APT photometry of Figure 1(c). Note the division in the period scale. The hatched region near ﹩P\approx 1\;\mathrm{year}﹩ contains artifacts of the seasonal sampling. The green and red horizontal dashed lines are the “excellent” and “poor” significance thresholds for the S-index periodograms, as defined in Baliunas et al. (1995). Note that the APT periodogram is scaled down by a factor of five for easy comparison and the magenta horizontal line is the “excellent” threshold for that series.
Other Images in This Article
Copyright and Terms & Conditions
© 2015. The American Astronomical Society. All rights reserved.