Image Details
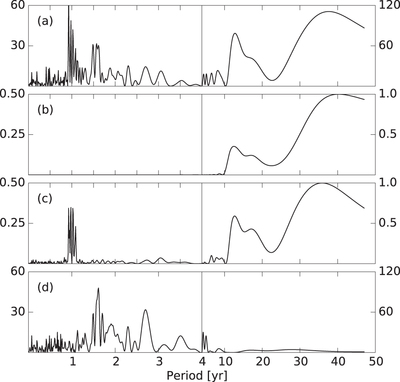
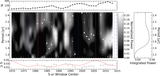
Caption: Figure 4.
Lomb–Scargle periodogram of (a) the original composite S-index time series (b) three-component cycle model with equal-spaced sampling (c) three-component cycle model with the same sampling as the original data (d) the residual of the original data minus the cycle model. Note that period and power scales change at the 4-year mark; the left and right y-axis give the power scale for that side. Periodograms of the cycle model are normalized to 1.
Other Images in This Article
Copyright and Terms & Conditions
© 2015. The American Astronomical Society. All rights reserved.
Copyright ©
2025 Astronomy Image Explorer. All Rights Reserved.