Image Details
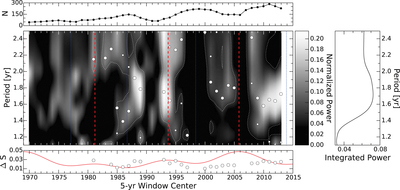
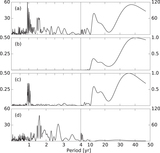
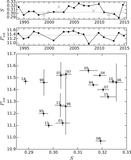
Caption: Figure 5.
Short-time Lomb–Scargle analysis. A Lomb–Scargle periodogram is computed for 5 year moving windows in 1 year increments of the composite S-index time series for HD 30495. The contour plot gives the periodogram power normalized by the number of data points as a function of time and period, with the 99.9% significance contour highlighted as a dotted white line. The indicated time is for the center of the 5-year window. In each window, the highest peak above the 99.9% threshold is found and plotted as a large open circle, while a secondary significant peak, if present, is plotted as a small open circle. Vertical blue and red dashed lines indicate the minima and maxima in the long-term cycle model.The top panel indicates the number of data points in each 5-year window. The right panel gives the integrated normalized power for all windows. The bottom panel plots the amplitude ﹩{\rm{\Delta }}S﹩ of sine fits of the significant peak periods in the windowed data as open circles, with the amplitude of the three-component cycle model in red.
Other Images in This Article
Copyright and Terms & Conditions
© 2015. The American Astronomical Society. All rights reserved.