Image Details
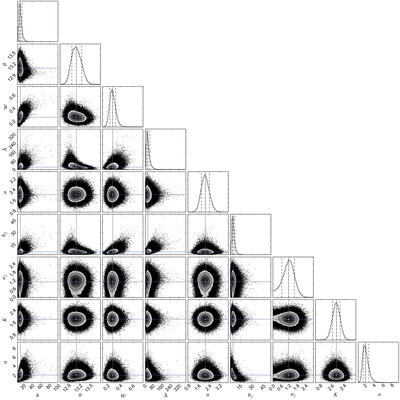
Caption: Figure 4.
Parameter distributions from our chosen GP + Keplerian model of the RV data plotted against each other. The median value of each parameter (blue lines) and 1σ ranges (dashed lines) are shown. The parameter ﹩a=h/{h}_{2}﹩.
Other Images in This Article
Copyright and Terms & Conditions
© 2015. The American Astronomical Society. All rights reserved.
Copyright ©
2025 Astronomy Image Explorer. All Rights Reserved.