Image Details
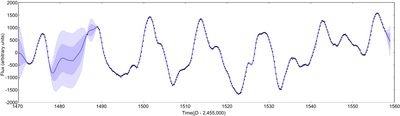
Caption: Figure 1.
Flux of Kepler-78 vs. time, as recorded by the Kepler spacecraft during its sixteenth quarter of observations. The data are plotted as black points, with photometric errors shown. The blue line corresponds to the Gaussian process regression of the photometry with the best-fit kernel hyperparameters, and the shaded regions correspond to 1σ and 2σ uncertainties, as defined by the posterior distributions of the kernel hyperparameters. The Kepler data has been shown as fitted with a single quasi-periodic kernel function and a white-noise stellar jitter parameter.
Other Images in This Article
Copyright and Terms & Conditions
© 2015. The American Astronomical Society. All rights reserved.
Copyright ©
2025 Astronomy Image Explorer. All Rights Reserved.