Image Details
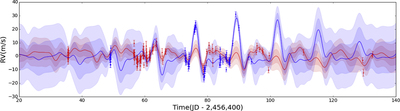
Caption: Figure 2.
RV of Kepler-78 vs. time, measured by Keck-HIRES and HARPS-N. The HIRES and HARPS-N data are plotted as blue and red points, respectively, with errors in RV shown. A Keplerian orbit signal with the calculated best-fit Doppler amplitude has been subtracted from the data. The colored lines correspond to the Gaussian process regressions with best-fit kernel parameters of the correspondingly colored RV measurements, where the shaded regions correspond to 1σ and 2σ uncertainties. Both data sets have been fitted with a single quasi-periodic kernel operator with common period, roughness, and lengthscale (θ, w, and λ) hyperparameters, but separate covariance amplitude and white noise (h and σ) parameters.
Other Images in This Article
Copyright and Terms & Conditions
© 2015. The American Astronomical Society. All rights reserved.