Image Details
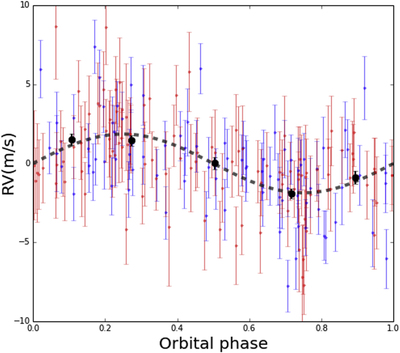
Caption: Figure 3.
Residuals of the HIRES and HARPS-N data after the quasi-periodic GP regression to the data with the Keplerian signal subtracted is removed, phase-folded at the known orbital period of the planet. HIRES data is shown in blue, and HARPS-N data is shown in red. The planetary signal model is shown by the dotted black line, and binned data are shown by black points.
Other Images in This Article
Copyright and Terms & Conditions
© 2015. The American Astronomical Society. All rights reserved.
Copyright ©
2025 Astronomy Image Explorer. All Rights Reserved.