Image Details
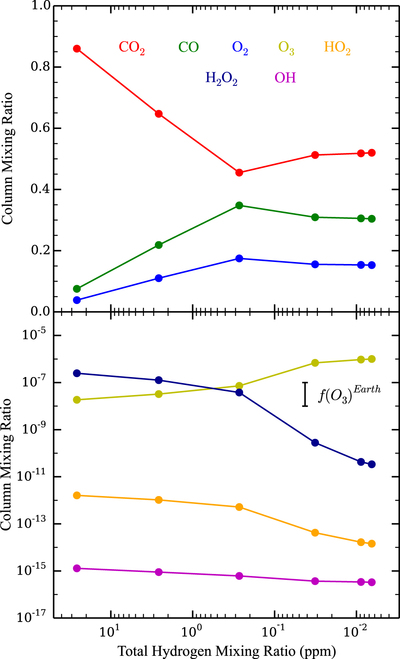
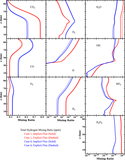
Caption: Figure 4.
Column-integrated mixing ratios of (top) CO2 (red), CO (green), O2 (blue), (bottom) O3 (yellow), HO2 (orange), H2O2 (dark blue), and OH (magenta) as functions of the total atmospheric hydrogen mole fraction for Cases 1 through 6. This mole fraction is calculated by dividing the number of hydrogen atoms in the atmosphere by the total number of atoms in the atmosphere. The points indicate the results of the actual cases, which are connected by lines. In the bottom panel we show the range in Earth's O3 mixing ratio ﹩f{({{{\rm O}}}_{3})}^{\mathrm{Earth}}﹩ (Yung & DeMore 1999). Note the different y-axis scales of the top and bottom panels.
Other Images in This Article

Copyright and Terms & Conditions
© 2015. The American Astronomical Society. All rights reserved.