Image Details
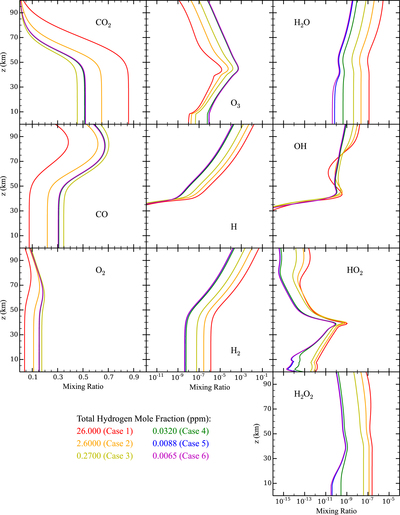
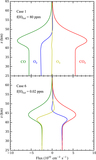
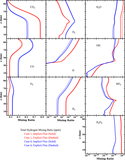
Caption: Figure 3.
Mixing ratio profiles of CO2, CO, O2, O3, H, H2, H2O, OH, HO2, and H2O2 for Cases 1 (red), 2 (orange), 3 (yellow), 4 (green), 5 (blue), and 6 (magenta). Note the different x-axis values for the three different columns. For many of the species, the curves for cases 4, 5, and 6 overlap each other.
Other Images in This Article

Copyright and Terms & Conditions
© 2015. The American Astronomical Society. All rights reserved.
Copyright ©
2025 Astronomy Image Explorer. All Rights Reserved.