Image Details
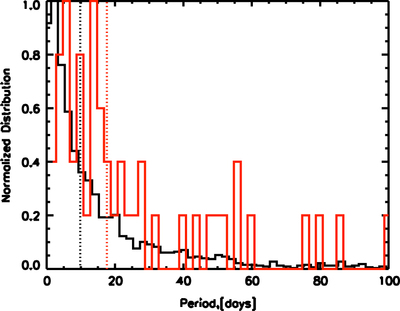
Caption: Figure 10.
Normalized period distribution of the KOIs (in black) and the Spitzer sample (in red). The KOI distribution is derived from Batalha et al. (2013). The vertical dashed lines correspond to the median value of each distribution. The two distributions are broadly consistent, except at the very shortest orbital periods.
Other Images in This Article
Show More
Copyright and Terms & Conditions
© 2015. The American Astronomical Society. All rights reserved.
Copyright ©
2025 Astronomy Image Explorer. All Rights Reserved.