Image Details
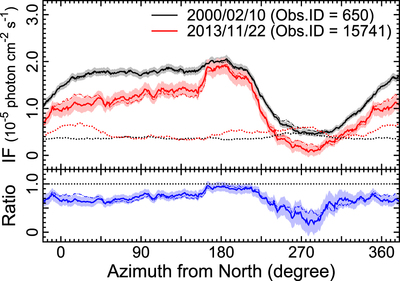
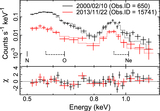
Caption: Figure 5.
Comparison of 0.5–1.2 keV background-subtracted azimuthal dependence in integrated flux in 2000 (black) and 2013 (red). The solid and dashed–dotted lines are the results of using different background estimates; the former used the one-eighth outward sectors at each azimuth angle, of which the background levels are shown by the dashed lines, while the latter is from the entire background annulus (see Figure 1 for details). The 1σ confidence ranges of the former estimates are illustrated by the color-coded bands. The lower panel indicates the ratios of 2013 to 2000 data.
Other Images in This Article

Copyright and Terms & Conditions
© 2015. The American Astronomical Society. All rights reserved.
Copyright ©
2025 Astronomy Image Explorer. All Rights Reserved.