Image Details
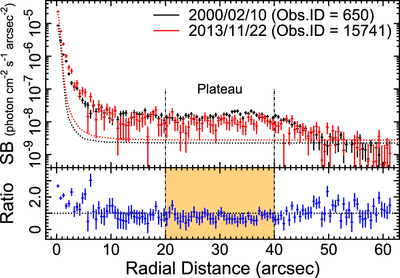
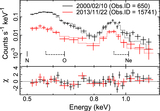
Caption: Figure 4.
Comparison of background-subtracted SB radial profiles of GK Per in 2000 (black) and 2013 (red) in the 0.5–1.2 keV band computed from the exposure-corrected photon-flux images, taking into account the degradation of the quantum efficiency of ACIS-S3. The dashed lines show 0.6 keV PSFs that were normalized to the maxima of the observed peaks, and further to the minima of the background levels. The lower panel indicates the ratios of 2013 to 2000 data, suggesting that the SB drop was 36% ± 6% in the 20″–40″ plateau area, which is indicated by the orange region and the dashed–dotted lines.
Other Images in This Article

Copyright and Terms & Conditions
© 2015. The American Astronomical Society. All rights reserved.
Copyright ©
2025 Astronomy Image Explorer. All Rights Reserved.