Image Details
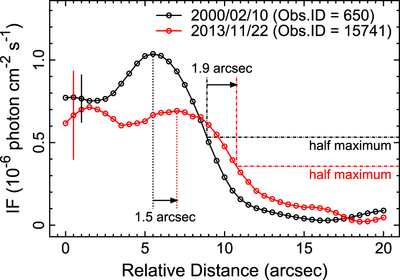
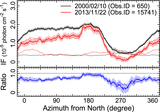
Caption: Figure 3.
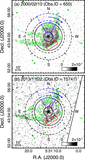
Radial projection profiles in the 0.5–1.2 keV band derived from the rectangular regions in Figure 1, smoothed by Gaussian blurs of 5 pixel radius at 2σ, are shown color-coded (black for 2000 and red for 2013). The vertical dotted lines mark the positions of the peak of the rim emission and the dashed–dotted lines are the half-maximum levels of each profile. Both indicate that the observed expansion of the X-ray nebula is approximately 1″–2″ in 13.8 yr. The typical 1σ uncertainties of the data points are represented by the vertical bars.
Other Images in This Article
Copyright and Terms & Conditions
© 2015. The American Astronomical Society. All rights reserved.
Copyright ©
2025 Astronomy Image Explorer. All Rights Reserved.