Image Details
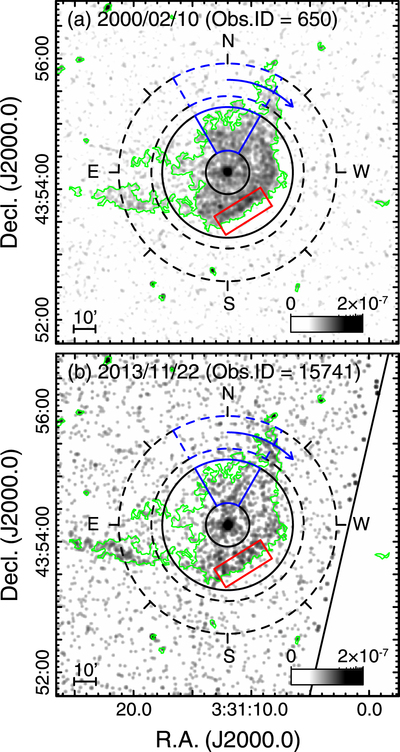
Caption: Figure 1.
Chandra ACIS-S3 0.5–1.2 keV photon flux images of GK Per in (a) 2000 and (b) 2013. Data were smoothed by a Gaussian blur with a 2σ radius of 5 pixels (2.″46), and were rendered with a logarithmic intensity grayscale covering up to 2 × 10⁻⁷ photons cm−2 s−1. The source and background extraction regions are indicated by the solid and dashed annuli, respectively. Areas of diffuse emission identified by the vtpdetect algorithm are shown as green polygons. The 45° blue sectors show the source and background extraction regions that were rotated in a clockwise direction to investigate the azimuthal dependence of the X-ray flux (see text and Figure 5). The red rectangles of size 50﹩^{\prime\prime} \times ﹩ 20″ parallel to a position angle of 122° are the regions used for the projection profiles of Figure 3. On the lower image, the edge of the CCD chip is also shown by the solid black line.
Other Images in This Article

Copyright and Terms & Conditions
© 2015. The American Astronomical Society. All rights reserved.