Image Details
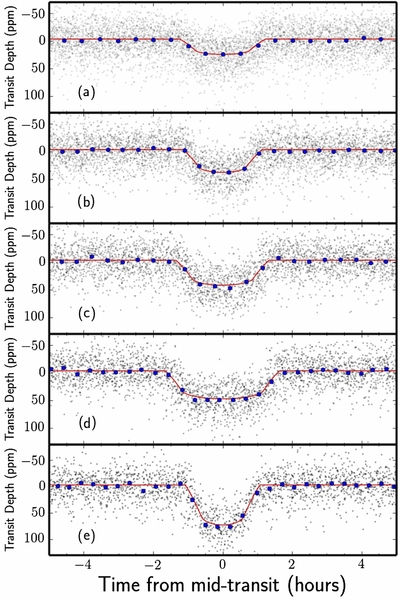
Caption: Figure 8.
Transit light curves for the five planets orbiting Kepler-444. From panels (a) to (e): transits of planets Kepler-444b, Kepler-444c, Kepler-444d, Kepler-444e, and Kepler-444f, respectively. The photometric light curves have been phase-folded on the orbital period of the planets to show the observed data as a function of orbital phase. Individual data points are shown as gray dots. Blue dots correspond to a binning of individual data points, shown only for clarity. The magnitude of the associated error bars is then given by the standard deviation of the data making up each bin divided by the square root of the number of points in the bin. These error bars are comparable in size to the blue dots. The best-fitting transit model, based on the maximum a posteriori parameter estimates, is shown as a red line.
Other Images in This Article
Copyright and Terms & Conditions
© 2015. The American Astronomical Society. All rights reserved.