Image Details
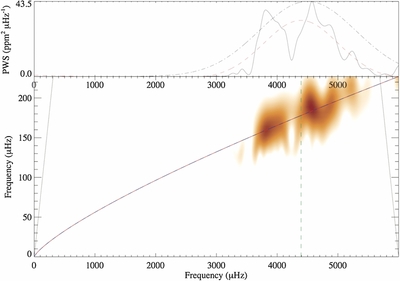
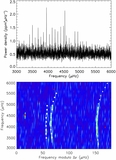
Caption: Figure 6.
Wavelet analysis of the oscillation power spectrum. Bottom panel: wavelet transform using a Morlet wavelet. The transform is affected by two priors. The first is that Δν and νmax must be consistent with a simple scaling relation (alternate blue-and-red curve; Stello et al. 2009a). This allows us to reduce the impact of power that lies well away from the scaling relation (by imposing a Gaussian fall-off with a characteristic scale on either side of this curve). The second prior is applied to νmax and kept wide enough as νmax = 4500 ± 800 μHz (represented by a dash-dotted curve in the top panel). The estimate of νmax returned by this analysis is represented by a vertical dashed line. The slanted solid lines toward the edges of the plotting area delimit the cone of influence. Top panel: same power wavelet spectrum with priors applied, but now integrated over the ordinate frequency (i.e., over all scales). The dashed curve represents a Gaussian fit to the wavelet spectrum.
Other Images in This Article
Copyright and Terms & Conditions
© 2015. The American Astronomical Society. All rights reserved.