Image Details
Caption: Figure 7.
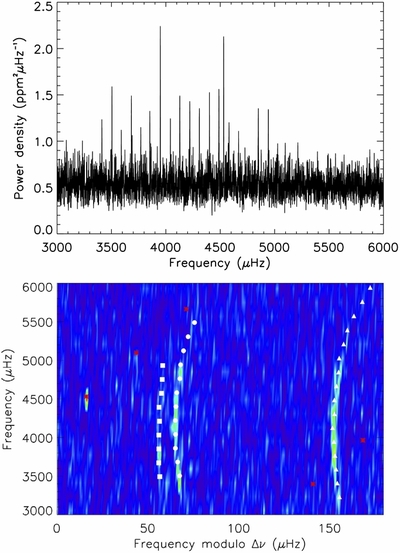
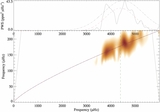
Top panel: frequency–power spectrum of the flux time series of Kepler-444 over the frequency range occupied by the solar-like oscillations. A boxcar filter of width 1.5 μHz has been applied to enhance p-mode visibility. Bottom panel: power spectrum of the Kepler light curve in échelle format. This is the graphical equivalent to slicing the spectrum into segments of length Δν = 179.64 μHz and stacking them one on top of the other. Note that, in order to center the power ridges on the diagram, frequencies have been shifted sideways by subtracting a fixed reference of 25.5 μHz (i.e.,  ). White symbols represent the observed oscillation frequencies. Symbol shapes indicate mode degree: l = 0 (circles), l = 1 (triangles), and l = 2 (squares). Red asterisks mark the harmonics of the inverse of the Kepler long-cadence period (Δt ~ 30 minutes), not all of which are present in these data. These artifacts appear in the power spectra of Kepler short-cadence time series.
Other Images in This Article
Copyright and Terms & Conditions
© 2015. The American Astronomical Society. All rights reserved.