Image Details
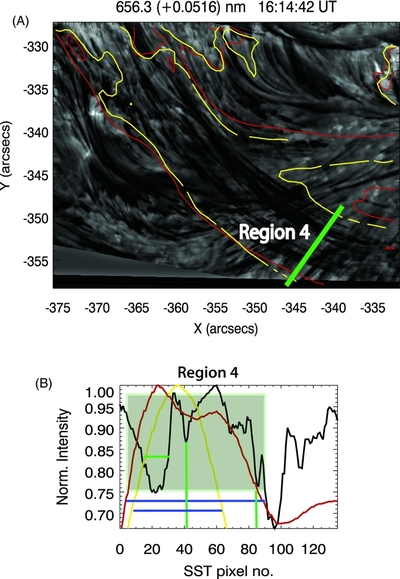
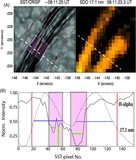
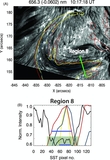
Caption: Figure 6.
Co-temporal and co-spatial Hα near red-wing images (grayscale), together with overlaid contours (17.1 nm: yellow and 21.1 nm: red), are presented in panel (A). The observations consist of a snapshot of a post C8.2 class flare system from 2012 July 1 (data set B). Panel (B) presents the normalized intensity cross-cuts of the post-flare loop-top (solid green line Region 4 in panel (A)) for the associated Hα signal (black curve) along with the respective curves of the 17.1 nm (yellow) and 21.1 nm (red) channels, as is contoured in panel (A). The shaded green boxes represent examples of associated fine-scale structures in Hα and the EUV lines from which we extract measurable strand cross-sections for our statistical sample. The blue horizontal lines represent the well-defined and measurable cross-sections of the EUV loops in contrast with the fine-scale structuring in Hα.
Other Images in This Article
Copyright and Terms & Conditions
© 2014. The American Astronomical Society. All rights reserved.