Image Details
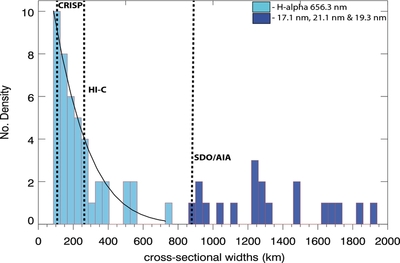
Caption: Figure 10.
Histogram displaying the distribution of all detectable strands and substructures within coincident Hα and EUV coronal loops, as measured from all of the data sets sampled. The pale blue sections correspond to the Hα-only detections made via CRISP. The darker blue sections correspond to the SDO/AIA coronal loop cross-sections. The vertical dashed lines mark the resolution limit for CRISP, Hi-C, and SDO/AIA. The number density of detected strands vs. their cross-sectional FWHM widths is measured. The exponential curve is overlaid onto the plot to indicate the steeping distribution toward finer scales within the substructures of coronal loops.
Other Images in This Article
Copyright and Terms & Conditions
© 2014. The American Astronomical Society. All rights reserved.